Lecture 2: Descriptive Statistics & Visualization

IN THIS LESSON
Summarizing nominal and ordinal data
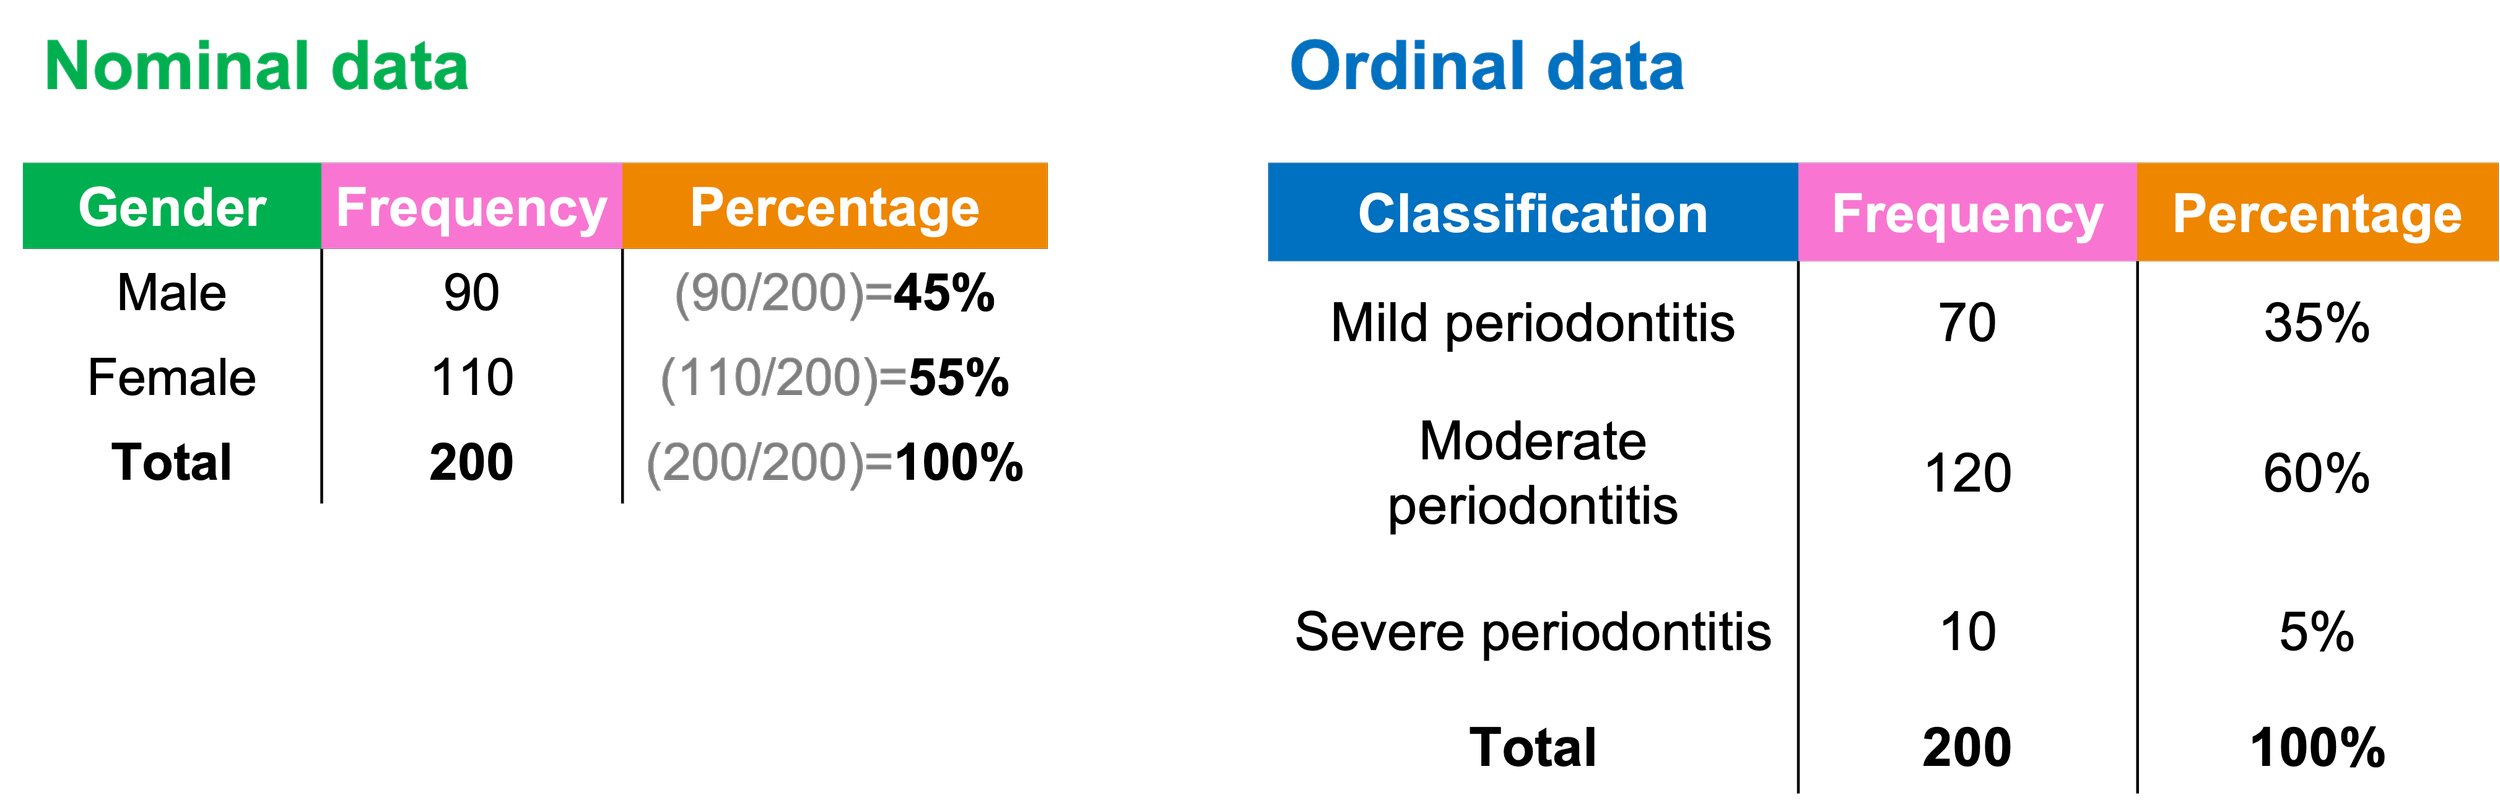
Frequencies and percentages are statistical tools used to summarize and analyze data, particularly useful for nominal and ordinal datasets.
Frequencies refer to the number of occurrences of each category or value in a dataset. For example, if a survey asks participants about their favorite color and 10 participants choose blue, the frequency for blue is ten.
Percentages translate these frequencies into a proportion of the total, expressed out of 100%. This helps to understand the relative size of each category in comparison to the whole dataset. Continuing the previous example, if we have a total of 40 participants, then blue would represent 25% of responses (10 out of 40).
Frequencies and percentages are commonly used when working with nominal data (categorical data without a natural order, like colors or brands) and ordinal data (categorical data with a clear order, like education level). They are helpful for summarizing survey results, demographic data, and any situation where categories are analyzed for insights into trends or preferences.